Fed
Funds Rate (FFR)
Wiki: “The federal funds rate
is an important benchmark in financial markets. The interest rate that
the borrowing bank pays to the lending bank to borrow the funds is
negotiated between the two banks, and the weighted average of this rate
across all such transactions is the federal funds effective rate.”
For our purposes we will use the
Effective Fed Funds Rate and call it simply the Fed Funds Rate.
The best source for this is the STL
FED:
What
the Fed Funds Rate does
My Summary:
Banks
are required to maintain a percentage level of the amount they are obligated to
pay out to loans (Think of it this way, I’m just doing some hand waving /
magic.)…..
When
they need additional capital to meet this reserve requirement banks will borrow
from other banks at the current Fed Funds Rate. Raising this rate will increase
the subsequent loan interest rate which will impede cash flows of businesses.
It’s like adding a resistor to the economy. Lowering the FFR will free up cash
flows, and incentivize investments and production.
Also
due to our fractional banking system as each loan is created the amount of
money materialized equals the loan amount minus the reserve requirement. Loans
create money. This is what drives our economy. No loans / No additional money.
Wiki:
“U.S.
banks… are obligated by law to maintain certain levels of reserves, either as
reserves with the Fed or as vault cash. The level of these reserves is
determined by the outstanding assets and liabilities of each depository
institution, as well as by the Fed itself, but is typically 10% of the total
value of the bank's demand accounts (depending on bank size)….”
”
For example, assume a particular U.S. depository institution, in the normal
course of business, issues a loan. This dispenses money and decreases the ratio
of bank reserves to money loaned. If its reserve ratio drops below the legally
required minimum, it must add to its reserves to remain compliant with Federal
Reserve regulations. The bank can borrow the requisite funds from another bank
that has a surplus in its account with the Fed. The interest rate that the
borrowing bank pays to the lending bank to borrow the funds is negotiated
between the two banks, and the weighted average of this rate across all such
transactions is the federal funds effective rate.”
“Interbank borrowing is essentially a way for banks
to quickly raise money. For example, a bank may want to finance a major
industrial effort but may not have the time to wait for deposits or interest
(on loan payments) to come in. In such cases the bank will quickly raise this amount
from other banks at an interest rate equal to or higher than the Federal funds
rate.Raising the federal funds rate will dissuade banks from taking out such inter-bank loans, which in turn will make cash that much harder to procure. Conversely, dropping the interest rates will encourage banks to borrow money and therefore invest more freely. Thus this interest rate acts as a regulatory tool to control how freely the US economy operates.
By setting a higher discount rate the Federal Bank discourages banks from requisitioning funds from the Federal Bank…”
The Federal Reserve and Actions That They Take
The best way to understand how the
Federal Reserve controls the economy is by playing a game that they themselves
created. The scariest aspect of this game is how close to reality it really is.
Notice how I had to keep increasing
the FFR in order to keep inflation down.

They were both normalized to 1 to allow use to look at it non-dimensionally.
Notice how the FFR in green gets raised, held steady when the market gets unstable, and sharply reduced when the economy tanks.
Take a look at what we know of so well. The Dot-com bubble of 2000 and the Housing bubble of 2008. Both fueled by a feverish need for capital, followed by defaulting loans (first business loans, then mortgages).
My greatest fear is that the Fed tends to maintain its rate when the economy is unstable, either due to recovery or expansion.

Notice how long the Fed has kept the FFR at zero.
Even more disturbing is combining this zero rate policy with Quantitative Easing (QE)
Wiki:
“Quantitative easing (QE) is a type of monetary policy used by central banks to stimulate the economy when standard monetary policy has become ineffective. A central bank implements quantitative easing by buying specified amounts of financial assets from commercial banks and other private institutions, thus raising the prices of those financial assets and lowering their yield, while simultaneously increasing the monetary base. This differs from the more usual policy of buying or selling short-term government bonds in order to keep interbank interest rates at a specified target value.”
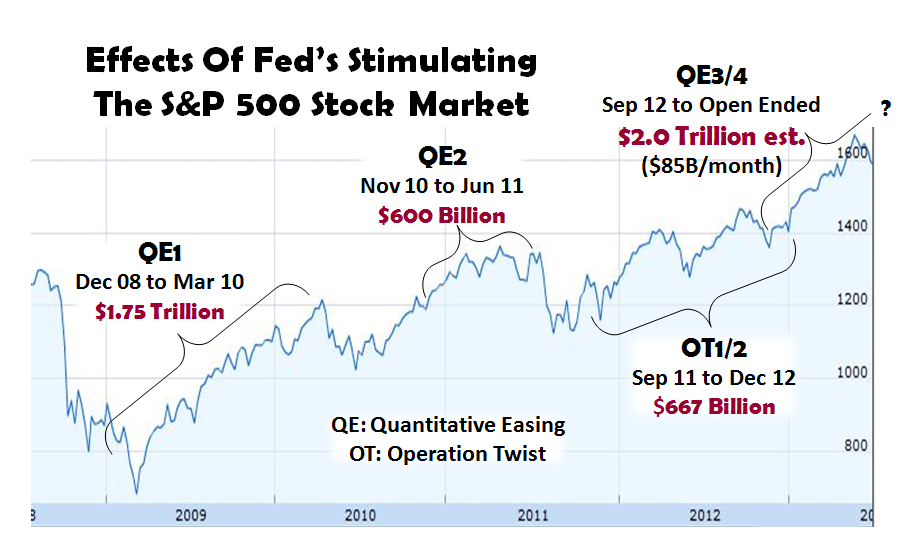
Notice how the market reacted to Trillions being pumped into the economy…
Also QE2 was announced right when the market started to rise again.
So QE worked wonders for the stock market. But let’s look into this even further.
Money Flow
Earlier we found that money creation and flow is extremely important to our economy. In fact it is our economy.
A leading indicator of money flow in the US is the velocity of the M2 Money Stock (M2V).
FED: “The velocity of money is the frequency at which one unit of currency is used to purchase domestically- produced goods and services within a given time period. In other words, it is the number of times one dollar is spent to buy goods and services per unit of time. If the velocity of money is increasing, then more transactions are occurring between individuals in an economy.
The frequency of currency exchange can be used to determine the velocity of a given component of the money supply, providing some insight into whether consumers and businesses are saving or spending their money. There are several components of the money supply,: M1, M2, and MZM (M3 is no longer tracked by the Federal Reserve); these components are arranged on a spectrum of narrowest to broadest. Consider M1, the narrowest component. M1 is the money supply of currency in circulation (notes and coins, traveler’s checks [non-bank issuers], demand deposits, and checkable deposits). A decreasing velocity of M1 might indicate fewer short- term consumption transactions are taking place. We can think of shorter- term transactions as consumption we might make on an everyday basis. The broader M2 component includes M1 in addition to saving deposits, certificates of deposit (less than $100,000), and money market deposits for individuals. Comparing the velocities of M1 and M2 provides some insight into how quickly the economy is spending and how quickly it is saving.”
https://research.stlouisfed.org/fred2/series/M2V/
Let’s add M2V to our previous graph.

The M2V now shown in yellow has been tanking.
A quote listed on the Wiki for this Sums up my fears
“In terms of the quantity theory of money, we may say that the velocity of circulation of money does not remain constant. “You can lead a horse to water, but you can’t make him drink.” You can force money on the system in exchange for government bonds, its close money substitute; but you can’t make the money circulate against new goods and new jobs.”
Samuelson, Paul Anthony; Economics (1948), p 354.
He said this about QE in 1948. 1948!!!!
We’re not the only ones concerned with the M2V going south

Sauce: snbchf.com
Well, So the Fed pumped trillions of dollars into the economy and it seems as though we are even worse off than we were before
This, This is bad.Oh Wait, It Gets Worse
Everyone is doing this.

And that’s pretty much the jist.
More to come on the influence of QE on our M2V,
Nate
No comments:
Post a Comment